Commute emissions analysis
Employee commuting is the Scope 3 category most often filled in with a national average. This one was built from the actual distances people travel.
Why the default answer is weak
Scope 3.7 covers emissions from employees travelling to work. Because the data is awkward to obtain, it's very commonly estimated by multiplying headcount by a national average commute, which produces a number that's the same shape whether your offices are in a city centre or an out-of-town business park.
Working from real distances
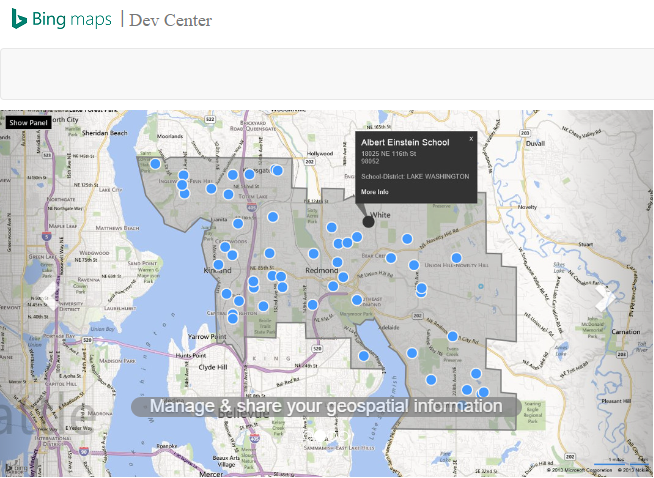
Routed distances for 30,000+ employees came from querying the Bing Maps API directly rather than assuming a figure, with national statistical emission factors applied on top so the modal split reflects how people in each country actually travel. That makes the analysis geospatial rather than headcount-based: the result responds to where sites actually are, and shows what would change if one moved.
The reporting value
A commuting figure derived this way is defensible under assurance and, more usefully, it is actionable: it can distinguish between sites, which an average never can.
- Role
- Analysis and data pipeline
- Scope
- GHG Protocol Scope 3.7
- Population
- 30,000+ employees
- Stack
- Bing Maps API, Python, statistical emission factors